Initial zeroes

Values in database are numeric like 1, 23, 587, 3, 56, 78.

When you are writing an SQL query you need to write values between apostrophes and values consist three digits, if the value is with one or two numbers, then initial  zero or two zeroes are needed. Finally values are separated with commas and framed with brackets.

1, 23, 587, 3, 56, 78 are written (‘001′,’023′,’587′,’003′,’056′,’078’). You can do this manually. However, Excel can help you.

If length of the value is one, then at the start we need to add ’00 and after the value ‘. If the length of the value is two, then we need to add ‘0 before the value and ‘ after the value. In case value is three digits long, then only apostrophes are added ‘ before the value and ‘ after the value.

=IF(LEN(C4)=1;”’00″&C4&”‘”;IF(LEN(C4)=2;”‘0″&C4&”‘”;IF(LEN(C4)=3;”‘”&C4&”‘”)))

We do not yet have SQL line.

I added commas after the values apart from the last value. CONCAT formula is creating one string from several cells. CONCAT is merging cells even though the cells would not be in a line.

Only brackets are missing.

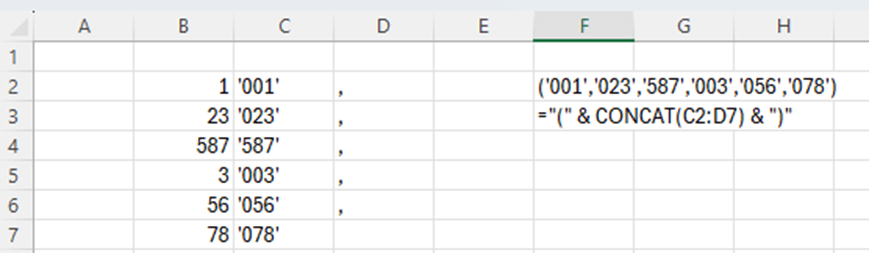
Now also brackets are in place.

We can write the query line.  Copy the cell F2 into your SQL editor.

WHERE field1 IN (‘001′,’023′,’587′,’003′,’056′,’078’)

Writing the WHERE line manually is not a big deal, but if you have long list of values, then this blog might be useful. As said earlier, it is nice to have Excel in use, even though it would not be required.  

Maven Video Game Sales

This data is downloaded from Maven Analytics data playground, here Free Data Sets & Dataset Samples | Maven Analytics . Thanks for Maven Analytics for publishing this data set. There are also four questions about data. I have answered here the question.

This time I have used Excel and Power BI to analyze the data.

  1. Which titles sold the most worldwide?

Excel.

Power BI.

Call of duty games are the best sold games. Grand Theft is the best-selling game but Call of duty with all the variations is still more popular than one Grand Theft.

When having a list of result, maybe Excel is a better tool.

2. Which year had the highest sales? Has the industry grown over time?

A new column release_year was created in power query.

Excel.

Visualization in Power BI.

For this question, Power BI visualization is a good way to present which years were the top ones.  

The best selling year was 2008. Generally the years 2007-2011 were the peak period.

3. Do any consoles seem to specialize in a particular genre?

In Power BI, I have selected the matrix.

This is an example of a matrix.

When we don’t have graphics but just matrix, Excel is doing good compared to Power BI.

Data provides several observations, here are some:

NG is specializing only in fighting and slightly sports. GBG was concentrating mainly on adventure and bit on role-playing. PCFX has only role-play.

The three consoles NG, GBG and PCFX which have concentrated on some genre, have not been selling very much. Top selling consoles like PS2, PS3 and PS4 are involved in many genres.


4. What titles are popular in one region but flop in another?

There are many examples of games which sold well in one region but poorly in another.

Assassin’s Creed and Assassin’s Creed II sold well in Europe&Africa and in North America but poorly in Japan. ATV offroad was popular in North America but not in Europe&Africa. Backyard Baseball and Backyard NFL Football were popular in North America but not in Europe&Africa. This is obvious as those sports are popular in North America. On the other hand, Brian Lara Cricket was doing better in Europe&Africa but not in North America.


Sales numbers are taken from different regions, Europe&Africa, Japan and North America. Column E is EA sales minus NA sales.