Standard deviation can be a useful function also in accounting and reporting. In case you want to compare some reports are sales steady or are the sales fluctuating.
Earlier Excel had a function STDEV, but that does not exist anymore.
Let’s calculate standard deviation manually.

We have values in column B. In column C we have average from column B. Column D indicates squared difference between the values and average. Sum of squared values equals to 24. 24 is divided either by number of values, in our case ten, or number of values minus one, nine. If you count the standard deviation for the sample we minus one from the count of values. When calculated for the population we divided by count of values.
Then you would get values 3 or 3,428571. Finally, you need to take square root from the number 3 or 3,428571. Square root from 3 is appr. 1,732 and from 3,428571 square root is 1,852.

Here the different standard deviation formulas have been used with the demo data.

Looks like STDEV.P and STDEVPA return the same value for the population. Also, STDEV.S and STDEVA return the same value for the sample.
All the formulas have just one array. They are rounded into three decimals.
DSTDEV is more complex to calculate the standard deviation from a matrix.
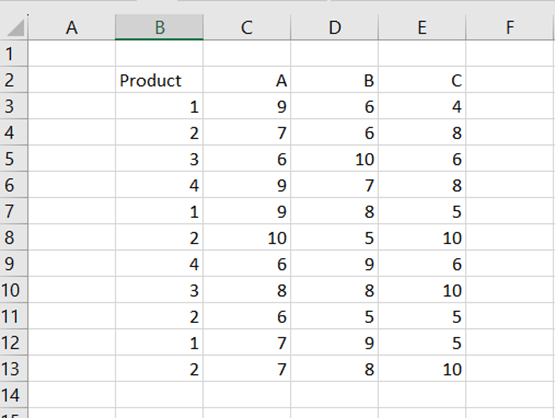
You have a sales report out of four products from one to four and out of three sales regions A, B, and C.
Then you would like to count the standard deviation for the product one in sales region A.
DSTDEV includes three arguments.
- Database: the data area B2:E13.
- Field: which sales area is investigated A, C2.
- Criteria: which product is investigated 1, B2:B3.
The product 1 has been sold three times in sales region A twice nine pieces and once seven pieces.
The results have been rounded into three decimals.
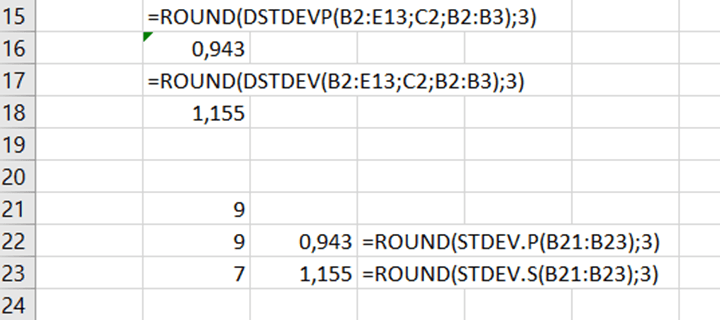
DSTDEV is for sample and DSTDEVP for population.
How about if you wanted to know the standard deviation for the product 2 in sales region A ? If you select criteria B2:B4, then the function calculates the standard deviation for both products 1 and 2 in sales area A.


