Nearly 6 million rows of data with Excel

How does Excel perform with millions of rows of data ? Is it possible to tackle a report of millions of rows with Excel and a normal laptop ?

The hardware I am using to handle the data is Intel core i5-6200 CPU @ 2,30 GHz and 6 GB of ram. The hard disk is a solid state drive.

I downloaded data from this page https://www.mavenanalytics.io/data-playground . Thanks for Maven Analytics for providing this data.

Let’s test.

Download the data first to your hard drive.

Then get data to your data model.

When loading the data, it is useful to check the headers. If Power query has not defined the headers correctly, press “Use first row as headers” in home -transform.

It took around six minutes to download the flight data, close to 6 M records, to the data model from hard disk. This means around one million records in a minute.

One transaction table and three lookup tables. Only the flights transaction table is massive.

Relationships.

Relationships in diagram view.

Create a pivot sitting on top of the data model.

Create a measure.

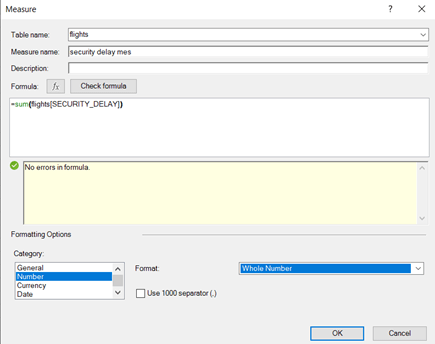
Summing the security delays.

Pivot selections.

The results.

The idea of this blog text was to test briefly how Excel with a normal laptop could handle millions of rows of data. Uploading the large table to data model took time, but once that was done, the rest went smoothly. Power Query and Power Pivot are scalable products which can handle reasonable large data amounts.

If you want to analyze a large data temporarily, Excel can do it according to my test. This test was not to play around with data, but just make short sample to see if tools and hardware can take the load.

Introducing eomonth

End of month EOMONTH returns the last day of the month.

However, the function returns the order number since Jan 1st 1900.

The first argument is date itself, the second is whether the month is before or after the date. 0 means that month to be investigated is the month from the date. In our case the month is January as the date is a January date and the month parameter is zero.

To have more useful value, change the number category to date. You get the format cell box by pressing control + 1.

Now it looks better.

As the month argument is -1, the last date is taken from previous month to given date. Last day of January 2020 was 31st.

This function looks quite funny, if you just want to know what is the last day of that month.

However, I have found two cases in finance when this function is useful, not only funny.

If you have a high value asset which is depreciated monthly, and you want to calculate depreciation per day. The asset is depreciated more in 31 days than in 30 days.

Asset annual depreciation value is 48 k€, and monthly depreciation is 4 k€. If you want to depreciate per day and depreciation are posted monthly, you need to calculate how many days are in that month.

The first day of the month can be calculated by taking the end of the previous month and adding one day.

Values in cells

D2: =EOMONTH($B$2;C2-1)+1  Last day of the previous month plus one.

E2: =EOMONTH($B$2;C2)  Last day of the month, in this case January.

F2:= =E2-D2+1 Counting the days of the month.

G2: =$B$1/SUM($F$2:$F$13)*F2 Counting the depreciation per day.

The sum F2:F13 is 365 and sum G2:G13 is 48 k sharp.

The same result can be calculated in a bit easier way, too.

The formula in E2 is =DAY(D2), so we just take days from D2. Sentence in F2 is =$B$1/SUM($E$2:$E$13)*E2.

Another possibility for EOMONTH function is statutory reporting, in case you manage your reporting with Excel.

If the reporting day is 3.7.2020, meaning July 3rd 2020, and you would like to have your reporting period, which is calendar month, automatically populated.

The reporting date is in B3. Supplementary values are in F1:F4.

The start date is defined with supplementary values in B6 and with sentence including embedded values in B7. The same case is with end date in B8 and in B9.

If you want reporting period based on the reporting date, the values are in B11 and B12.

Please note that cells B6:B12 are just values and not numeric fields for further calculations.

B14 and B15 can be used for calculations.

In B15 the sentence ends with +0. This does not change the value, but it changes the result directly to date format.

The sentences are here below for copy pasting.

=”1.”&($F$3)&”.”&($F$4)

=”1.”&(MONTH($B$3))&”.”& (YEAR($B$3))

=($F$2) & “.” & ($F$3) & “.” & ($F$4)

= (DAY(EOMONTH($B$3;0))) & “.” & (MONTH($B$3)) & “.” & (YEAR($B$3))

=”1.” & ($F$3) & “.-” & ($F$2) & “.” & ($F$3) & “.” & ($F$4)

=”1.”&(MONTH($B$3))&”.”& “-” & (DAY(EOMONTH($B$3;0))) & “.” & (MONTH($B$3)) & “.” & (YEAR($B$3))

=EOMONTH(B3;-1)+1

=EOMONTH(B3;0)+0